Vectoria Forecast Intelligence App
- Company
- Curve.tech
- My role
- UX/UI Design Lead
- Team
- Product, Engineering & Data Science
- Timeline
- 2019 – 2022
- The challenge
- Brand managers couldn’t act on sales forecasts on the go.
- What I did
- Led contextual research across CPG companies and shaped a mobile-first forecasting experience, from card-sorting to shipped UI.
- Outcome
- ~40% faster time-to-decision · +200% mobile use of forecasts · −12% forecasting errors · 93% task success in usability testing
Starting point
“What if you could see tomorrow’s sales — and act on them today?”
Forecasting in the consumer goods space is often siloed, reactive, and slow. Brand managers rely on spreadsheets and intuition, rarely accessing real-time projections they can trust — let alone act on from their phone. Vectoria was built to close that gap.
By visualizing short- and long-term forecasts through a layered mobile UI, Vectoria turns complex data into digestible insights — empowering users to take action, not just observe. This idea stemmed from shadowing brand managers struggling to make on-the-go decisions in fast-moving retail environments.
See the full design process Research, personas, flows and prototypes
Discovery & Research
The team started with contextual inquiry sessions across CPG companies — including interviews with brand managers, planners, and field sales leads. One consistent theme emerged:
“We don’t lack data. We lack visibility and timing.”
Despite having access to forecasts, users found them too abstract, too late, or too hard to interpret.
From these insights, the team narrowed in on three user goals:
- See what’s happening now, today, this month.
- Understand what changed — and why.
- Take immediate action on products that need it.
Early research also shaped the product direction:
- Introduce quick-glance metrics on quantity, revenue, and returns.
- Visualize forecast changes over time, side-by-side with actuals.
- Segment forecasts by channel, warehouse, or customer — without breaking UX.
Initial design prototypes were validated via weekly reviews with stakeholders and live feedback sessions with external beta testers.
Wireframing & Prototyping
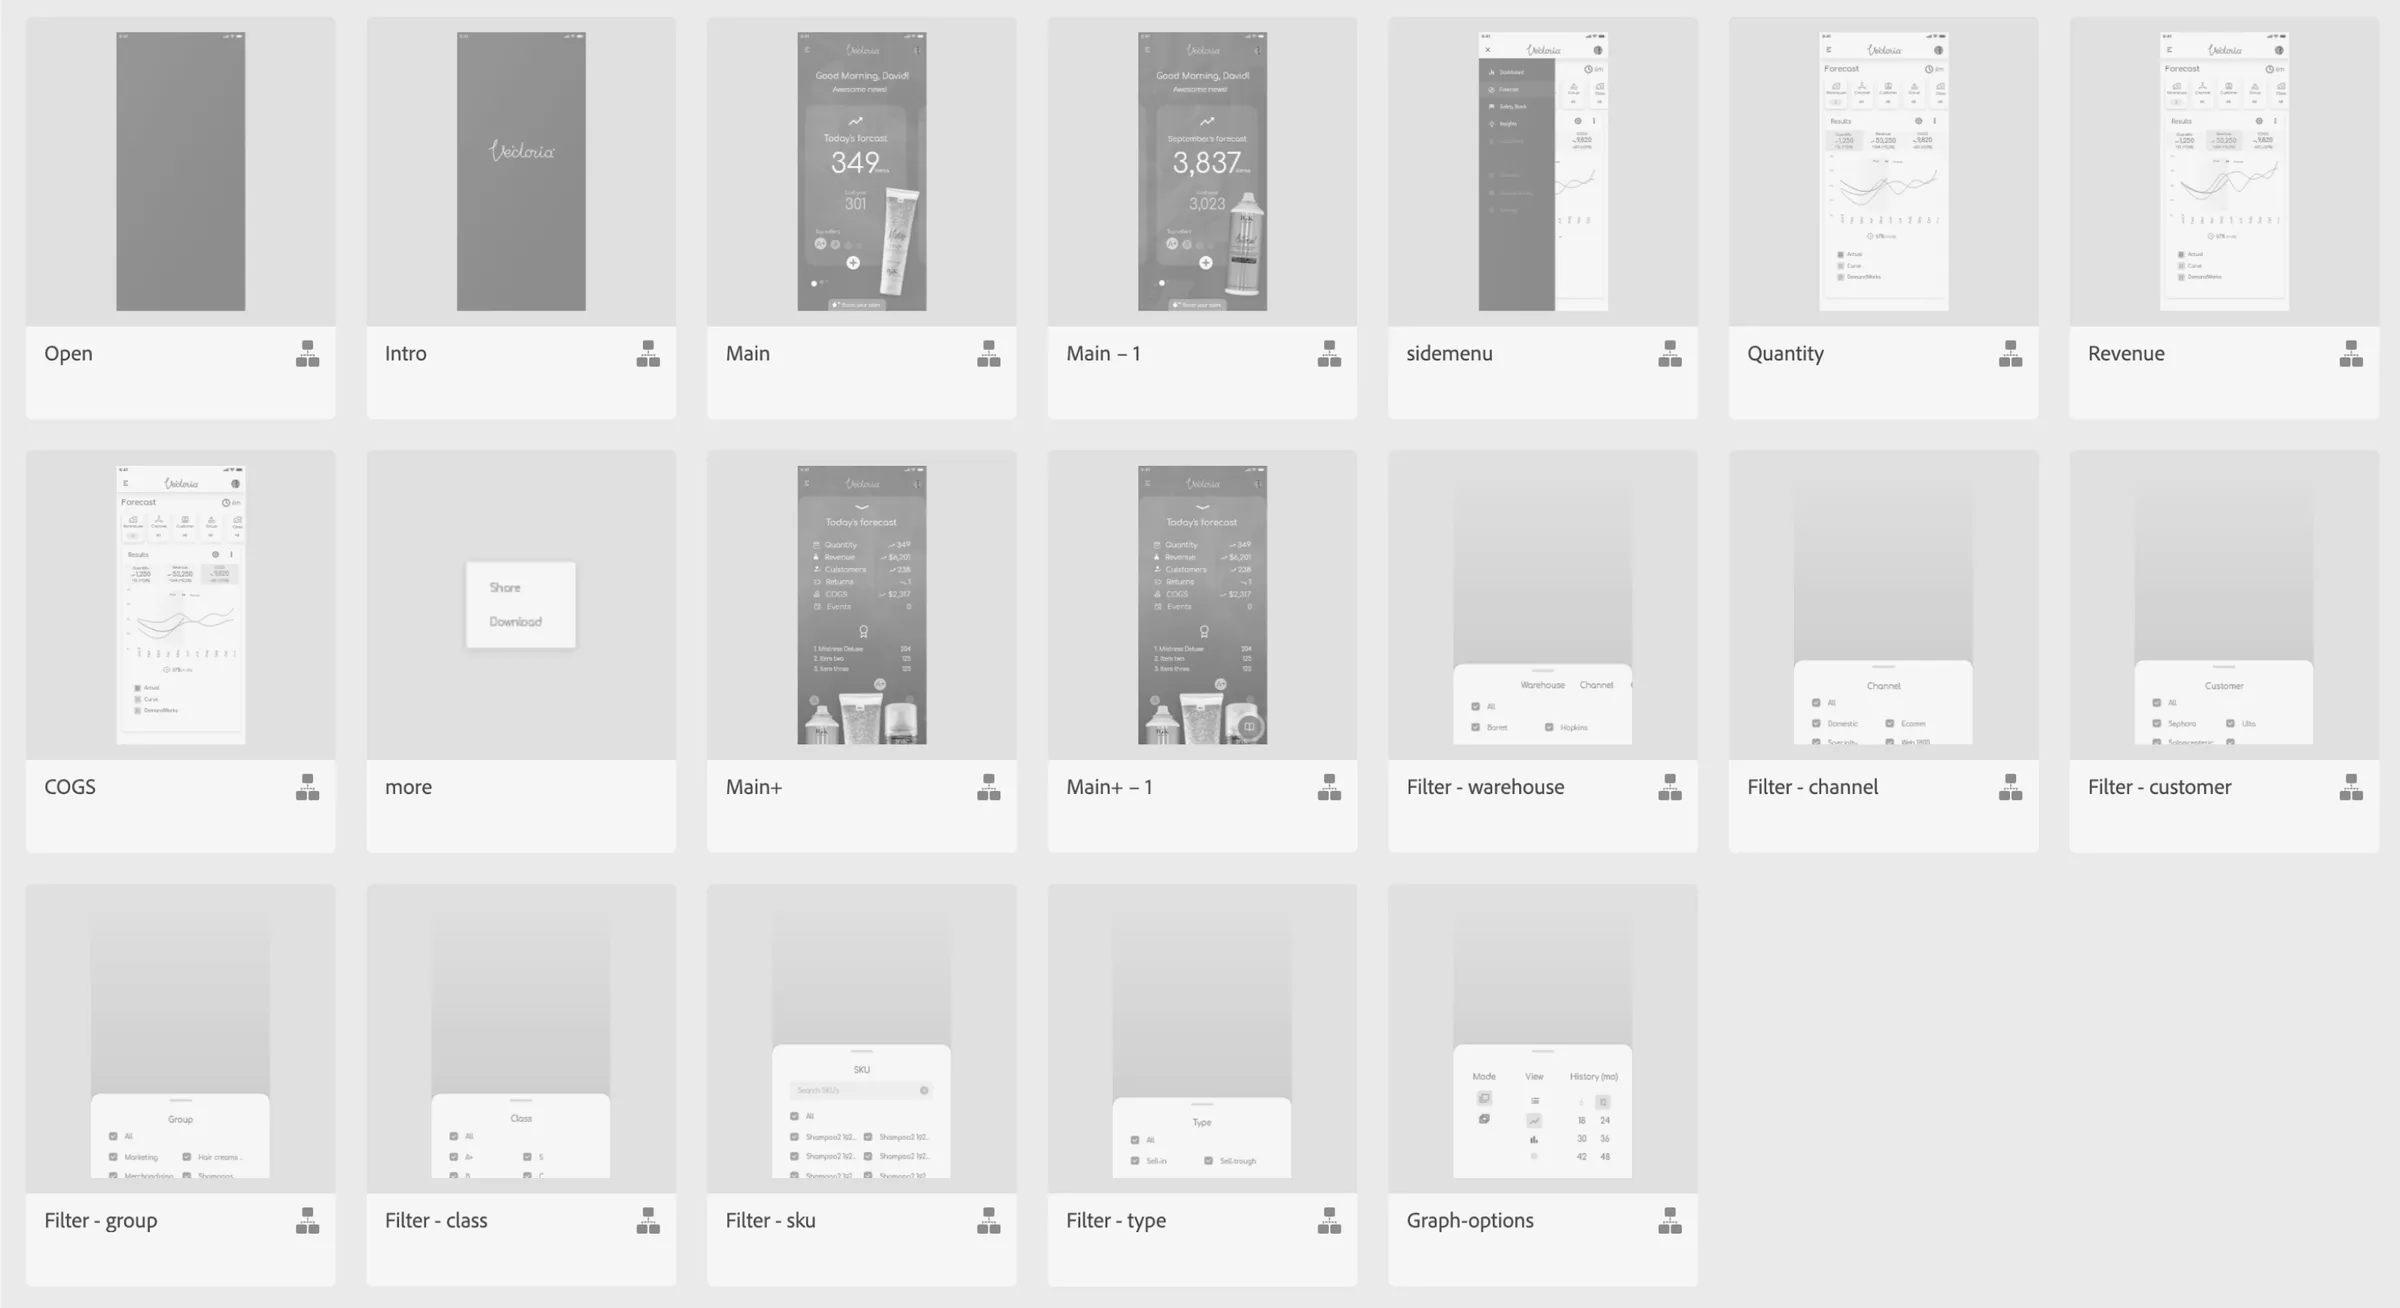
The design process began with lo-fi sketches and rapid card-sorting exercises to define prioritization logic. Using Figma, the team iterated across three fidelity levels — starting with dashboard blocks, then card interactions, and finally full flows.
Testing revealed users responded best to:
- Mobile-first cards that mimic real packaging or SKUs.
- Forecast comparisons visualized as deltas, not static values.
- Clear separation between "explore" and "act" moments.
Prototypes included motion specs and native behaviors to support engineering handoff — especially around dynamic filters and layered forecast models.
Personas & Journeys
- Brand Manager Persona:
Mid-level managers responsible for product lines across retail or digital channels. They need clear metrics and minimal clicks to trigger next steps like promotions, restocks, or alerts. - Sales Planner Persona:
Operates across territories or accounts, relying on accurate forecasting to meet sales targets and avoid stockouts. - Customer Persona (Internal):
Field reps and executives who want high-level confidence in forecasts, especially during key sales cycles.
These personas informed two journey tracks:
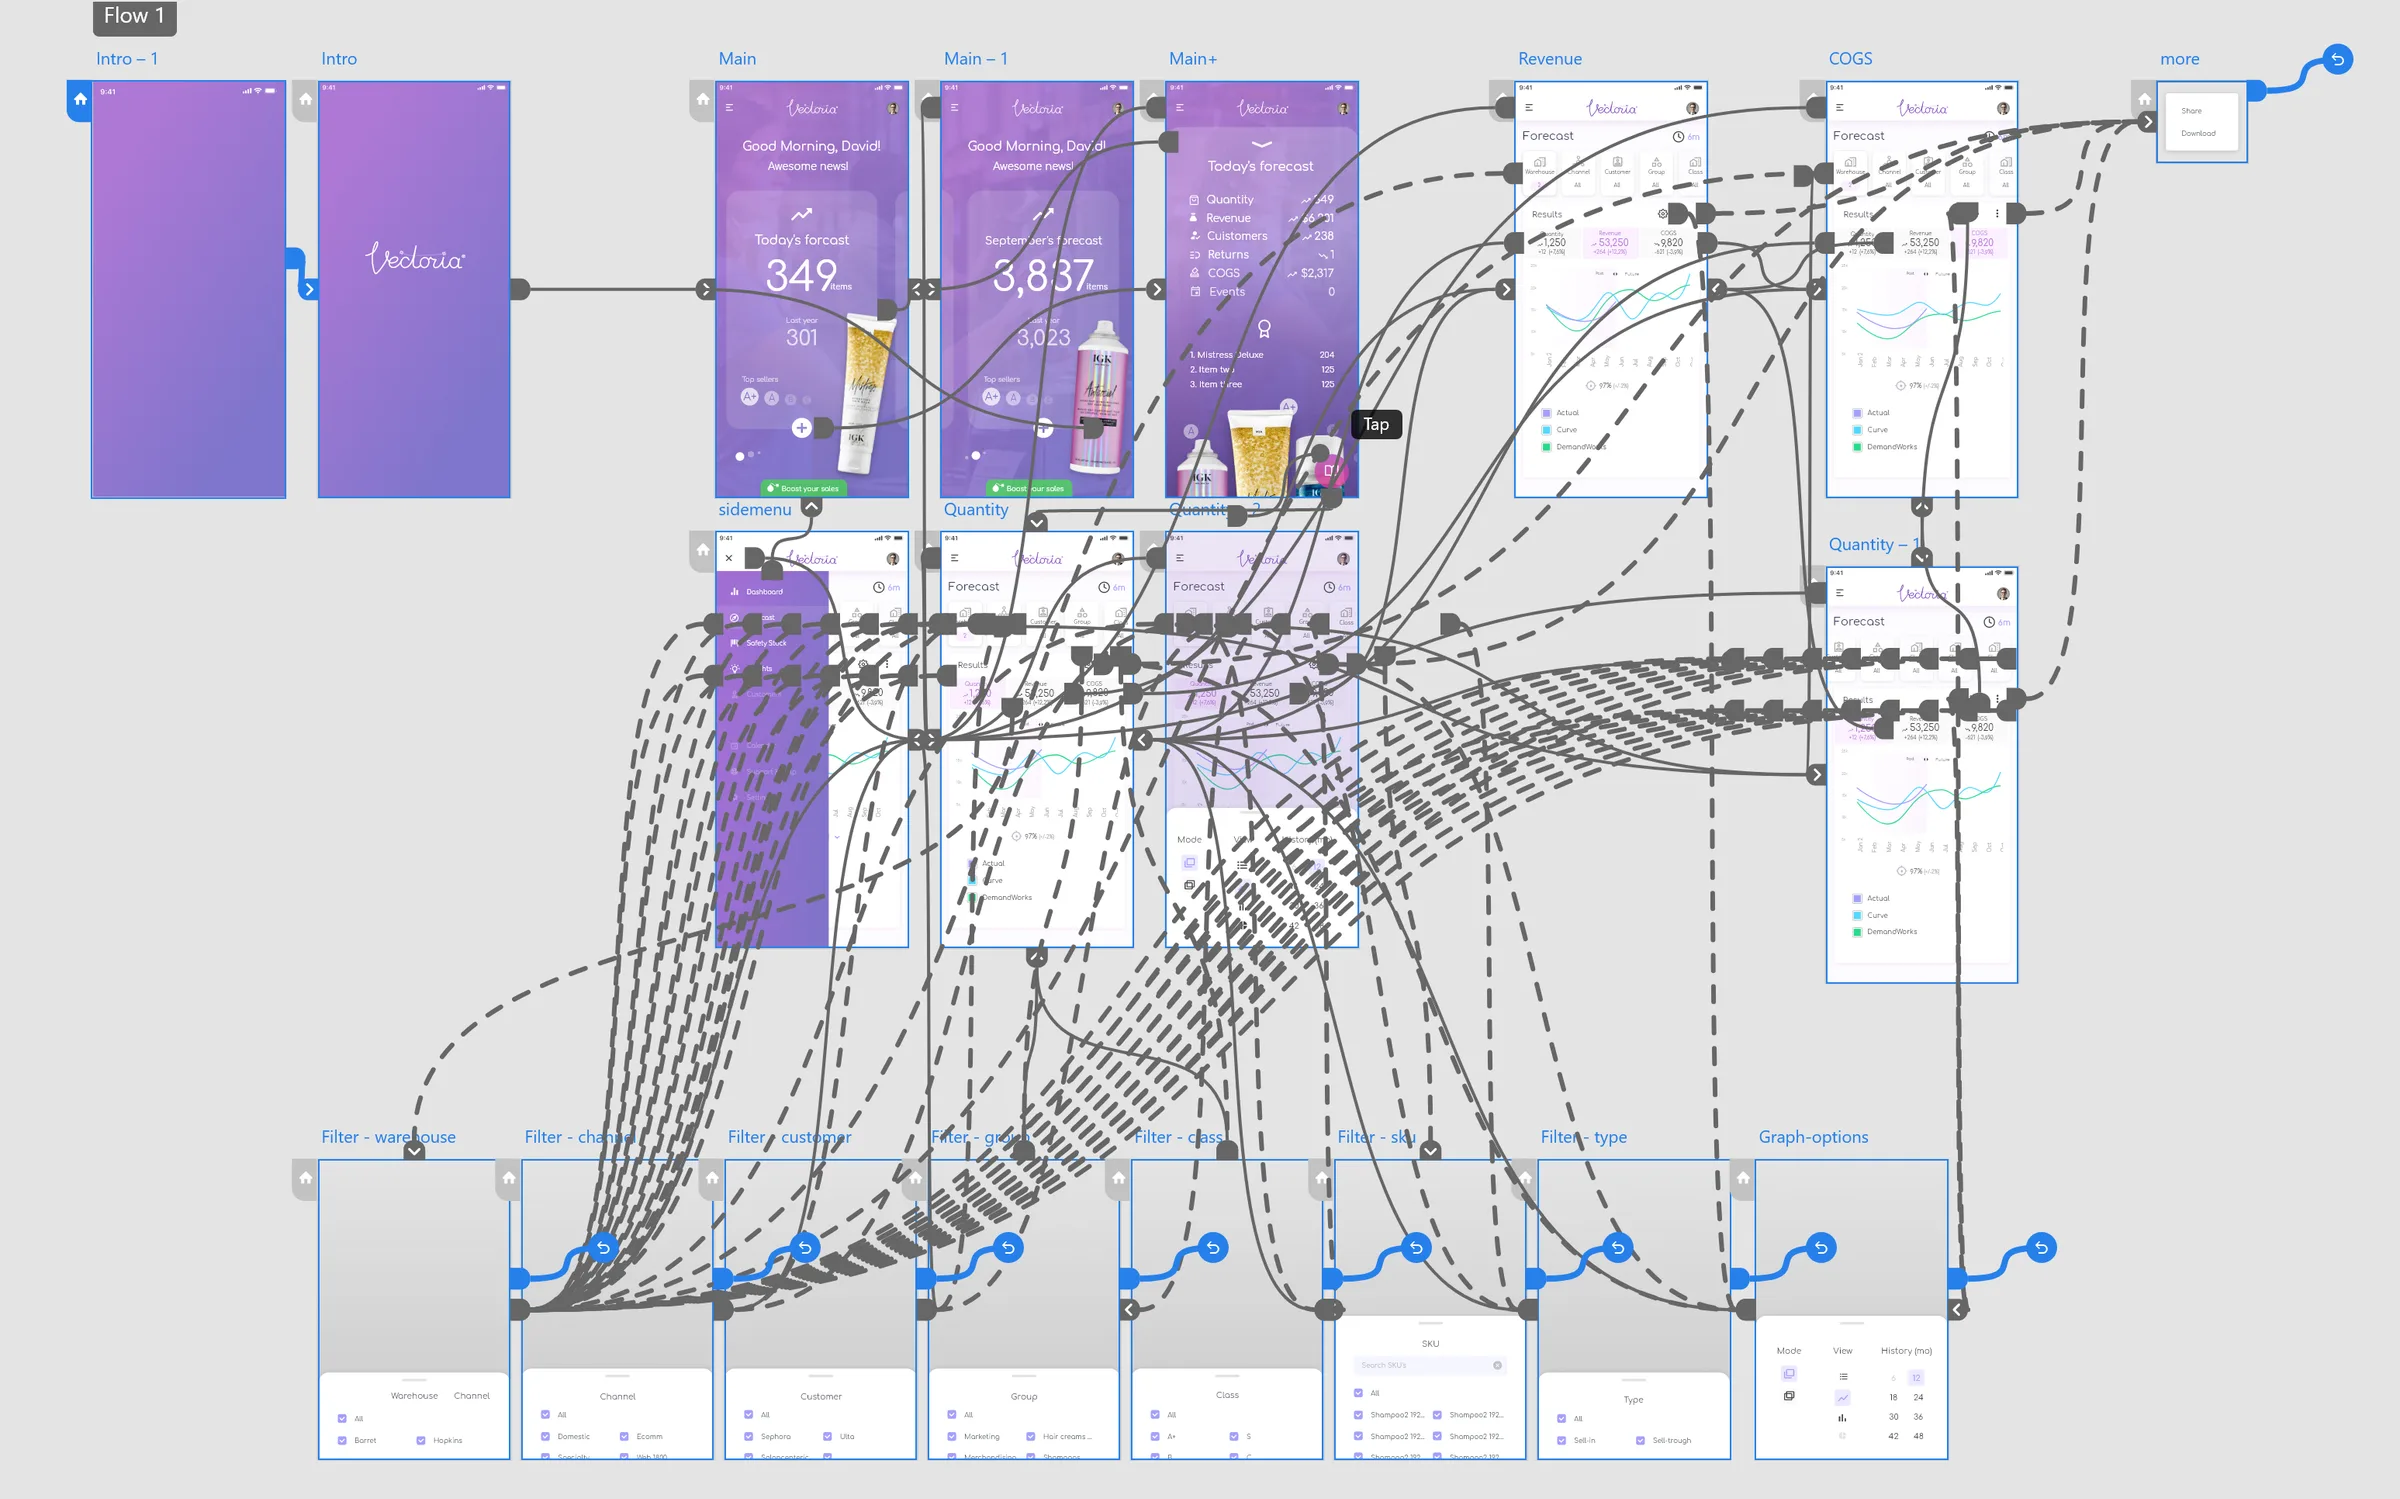
- Quick Insight to Action (Dashboard → Product card → Quick boost)
- Deep Dive Analysis (Forecast → Filters → Trend visualization → Export or share)
User flows
Each screen was structured with intentional simplicity:
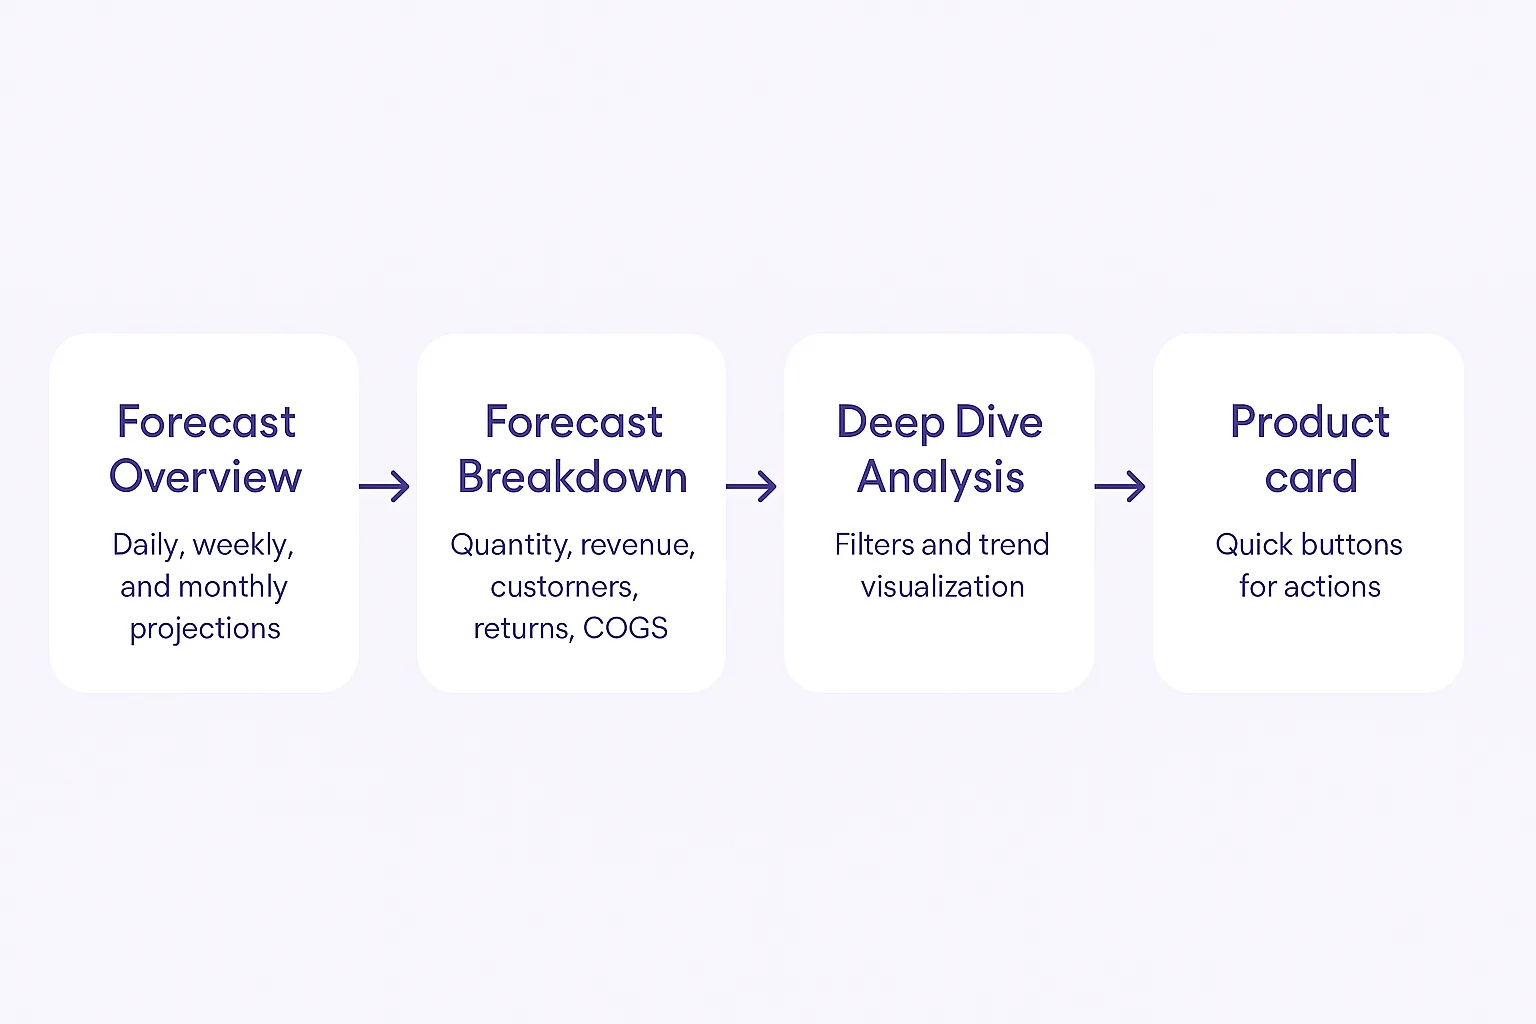
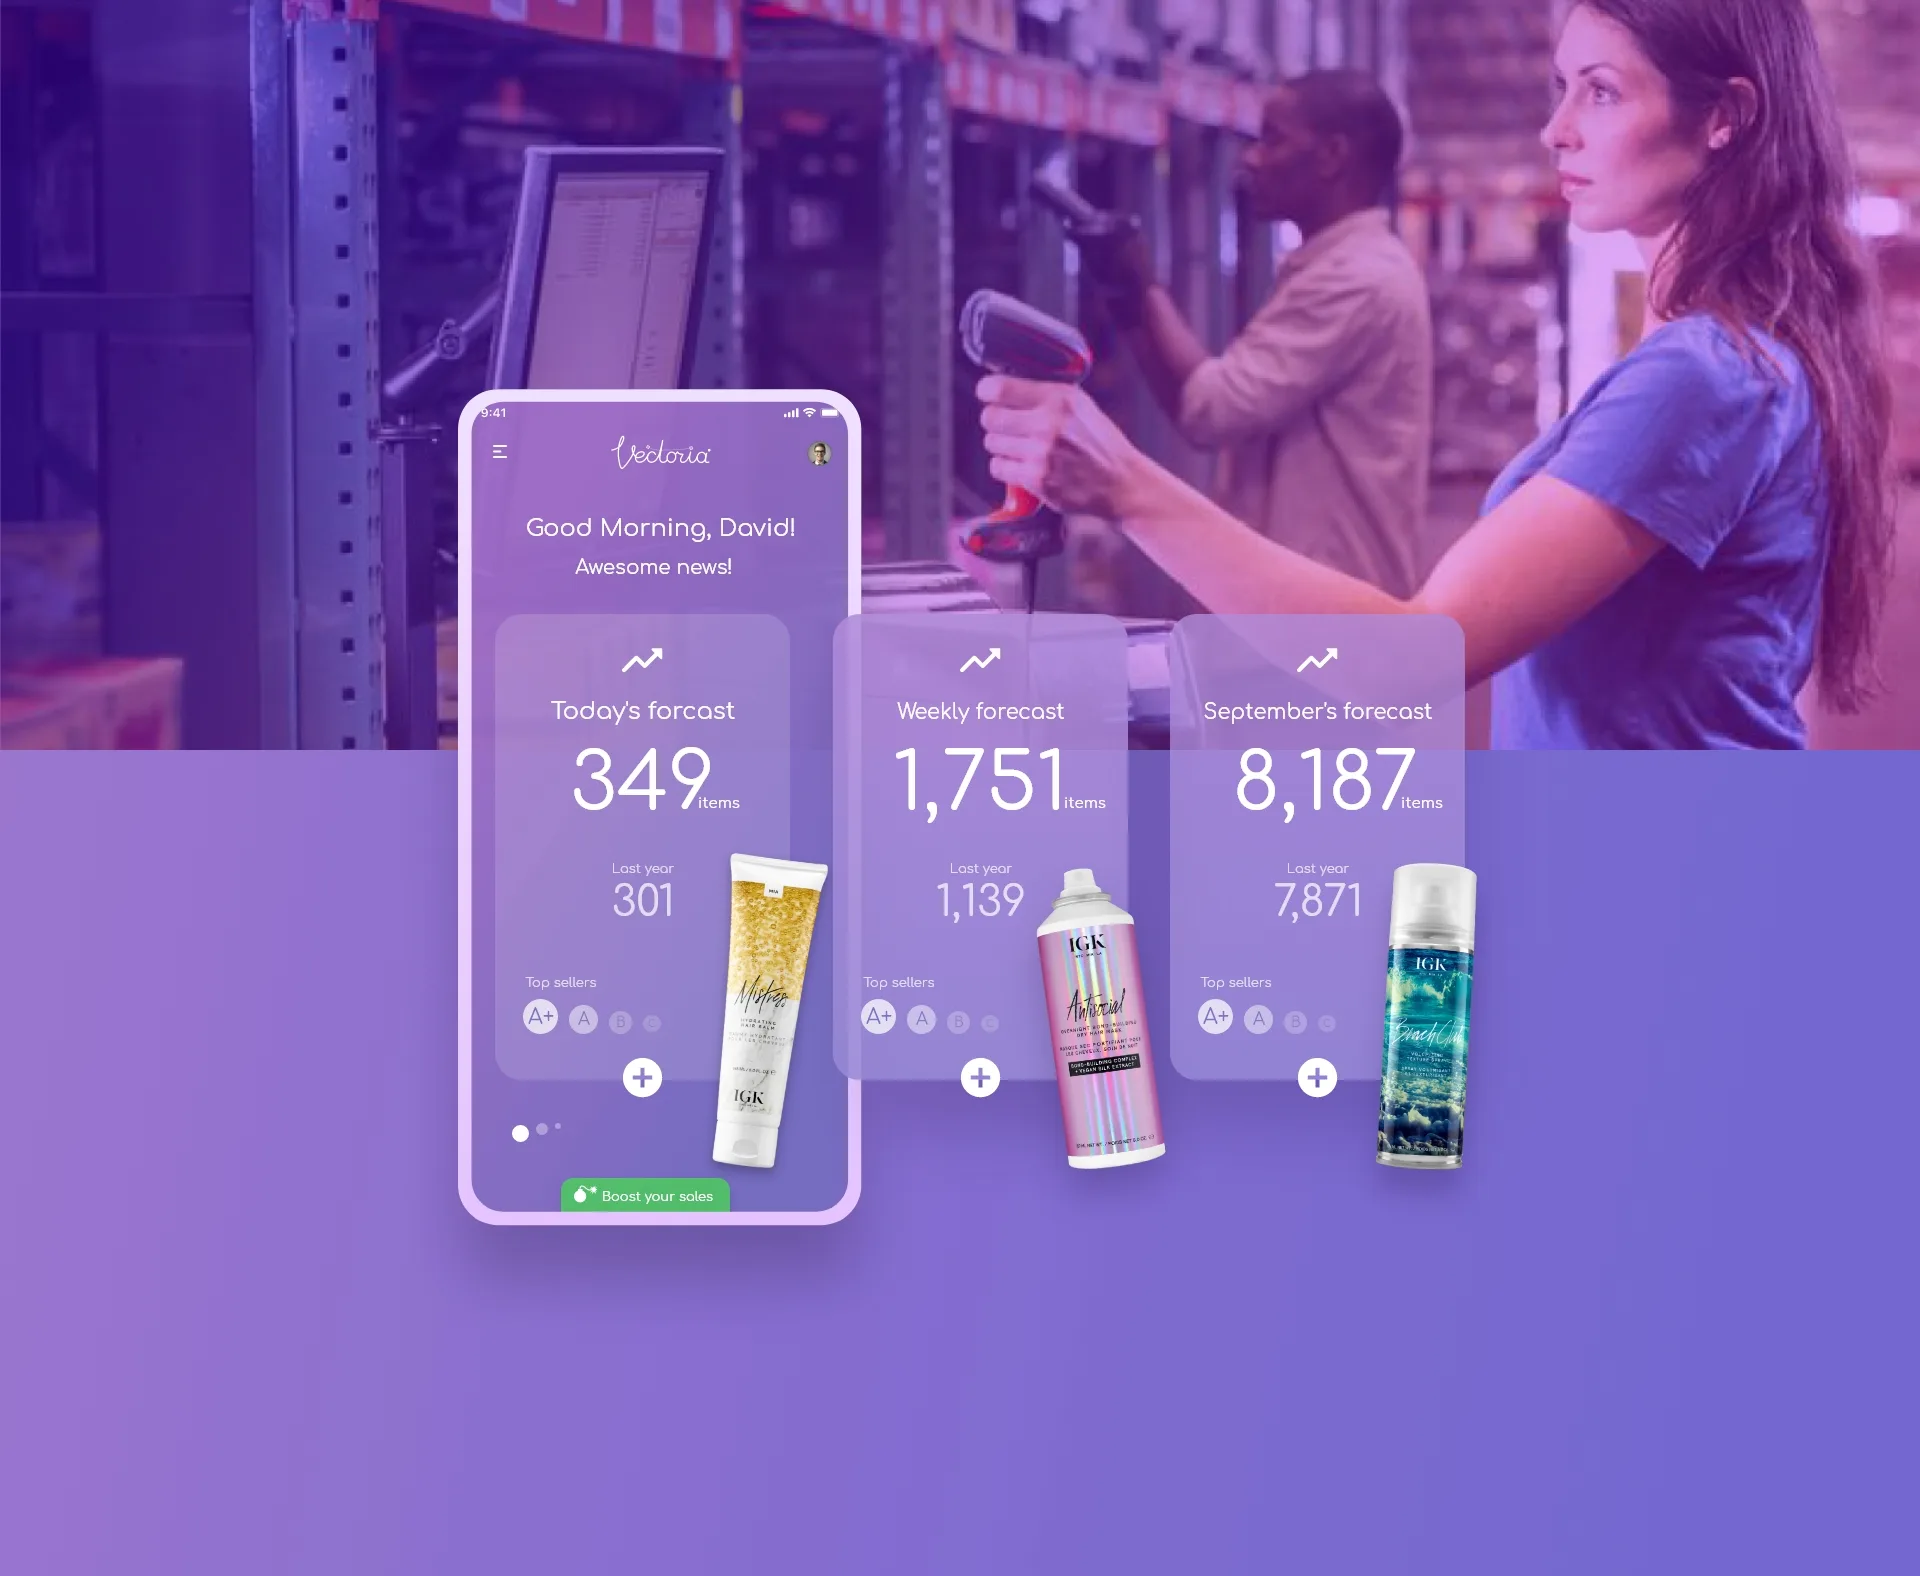
- Users land on a Forecast Overview, showing daily, weekly, and monthly projections — including YoY comparisons and trending indicators.
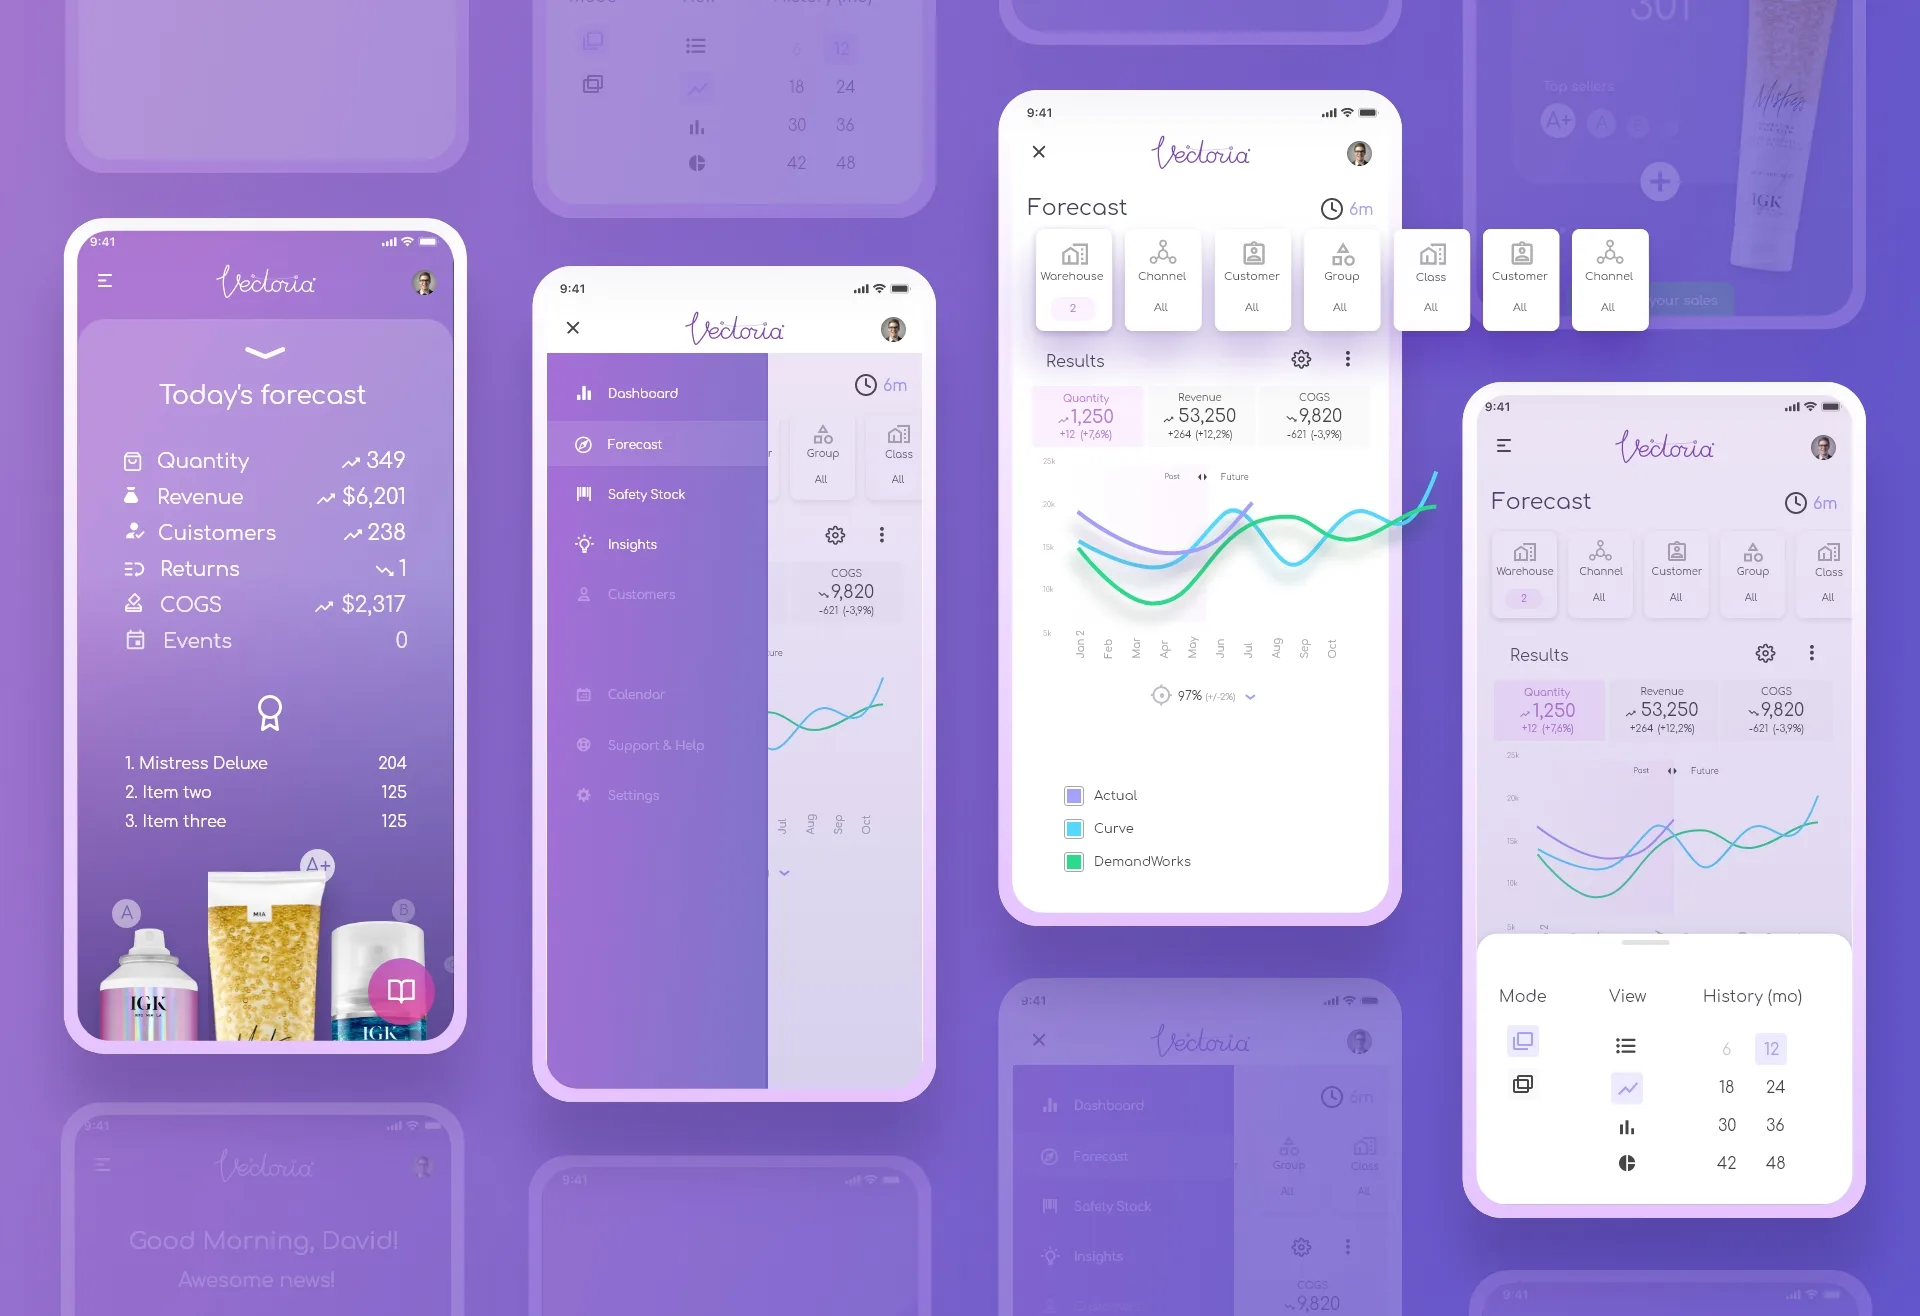
- Tapping "+" on any card opens a Forecast Breakdown — revealing key KPIs: quantity, revenue, customers, returns, and COGS.
- From there, a dedicated “deep dive” action launches the forecast analysis tool, allowing users to filter by warehouse, channel, or customer.
- A timeline graph shows three lines: actuals, internal forecast, and model-based (AI) forecast — with prediction accuracy and deltas.
Throughout, microinteractions and transitions guide the user’s focus while minimizing cognitive load. The “Boost your sales” CTA was designed to surface proactive suggestions or automate small tasks.
Final UI
The shipped experience features:
- A personalized forecast dashboard, highlighting today’s trends.
- Top-selling product cards with quality ratings and quick access buttons.
- A forecast deep-dive screen with multi-layer filters (warehouse, channel, class) and a rolling graph comparing actuals vs. models.
- Forecast confidence indicators and suggested actions based on demand shifts.
The UI balances clarity, actionability, and trust — presenting real complexity in a mobile-native, consumer-level experience.

Designing for AIHow we made the AI understandable and trustworthy
Model vs. people, side by side
The timeline shows actuals, the internal forecast and the AI forecast together, with deltas — so users can judge the model instead of blindly trusting it.
Accuracy you can see
Each forecast shows how accurate the model has been, which helped teams decide when to rely on it.
From insight to action
“Boost your sales” turns a forecast shift into a suggested next step, while the final decision stays with the brand manager.
Impact
- ~40% reduction in time-to-decision for brand teams
- +200% increase in mobile adoption for forecast usage
- 12% reduction in forecasting errors after first quarter
- 93% success rate in user testing of new flow
What I learned
Building Vectoria reinforced the principle that data products are UX products. Forecasting is only useful if it’s timely, interpretable, and trusted.
Balancing AI-generated predictions with human decision-making required us to:
- Design for confidence, not just accuracy
- Surface what matters now, not everything at once
- Enable action, not just awareness
By reimagining forecasting as a user-first, mobile-first experience, we helped redefine how CPG teams plan — and respond.
What I’d do differently now
I would ship a thinner first version sooner. The “see it → understand it → act on it” loop proved itself in testing, and real usage data would have told us faster which forecasts brand managers actually acted on.
Hiring a design leader?
Let’s talk about how I can help your team.